fk <- fligner.test(value ~ group)$p.value      # Fligner–Killeen: robust test of equal variances
if (fk >= 0.05) {
  wilcox.test(cases, controls)                  # equal spread: Wilcoxon rank-sum
} else {
  lawstat::brunner.munzel.test(cases, controls) # unequal spread: Brunner–Munzel
}Maternal B-vitamin intake and complex congenital heart defects
Statistical analysis of a Mexican case–control study · Nutrients 2026
Article: Vilchis-Gil J, Gómez-Jiménez AM, Santillán-Orgas ME, et al. Maternal Dietary B-Complex Vitamin Pattern and Risk of Complex Congenital Heart Defects in a Mexican Population. Nutrients 2026; 18(16): 2693. doi:10.3390/nu18162693 (open access) · Code on GitHub
Every number on this page is taken from the published article.
1 · Design
75 vs 160
mothers of children with a complex heart defect vs control mothers
→
2 · Exposure
5 vitamins
B1, B2, B3, B6, B12 from a food-frequency questionnaire, per 1000 kcal
→
3 · Index
PC1 = 74.9%
one principal component summarises the five correlated vitamins
→
4 · Result
OR 0.707
per unit of the index (95% CI 0.586–0.843, p = 0.0001), adjusted
Summary
Question. Congenital heart defects affect 3 to 8 of every 1000 live births; in Mexico, an estimated 12,000 to 16,000 children are born with one each year. B-complex vitamins take part in interconnected pathways (one-carbon metabolism, mitochondrial energy production) that early cardiac development depends on, but most studies have looked at one vitamin at a time. Is a mother’s combined dietary intake of these vitamins during pregnancy associated with a complex heart defect in her child?
Answer. Mothers of affected children had significantly lower energy-adjusted intakes of all five B vitamins studied (all p < 0.01). After adjusting for maternal age, total energy intake, vitamin supplementation and periconceptional folic acid, each one-unit increase in the B-Complex Index was associated with a 29.3% decrease in the odds of a complex defect (adjusted OR 0.707, 95% CI 0.586–0.843, p = 0.0001).
The statistics in four decisions
- Tests chosen by the data, not by habit: a variance check (Fligner–Killeen) decides between Wilcoxon and Brunner–Munzel for each variable.
- Correlated exposures handled with PCA: one index instead of five unstable coefficients.
- Odds ratios read correctly for a case–control design.
- The model was checked, not just fitted: simulated quantile residuals (DHARMa) and influence diagnostics.
My role
I am the second author, credited with the formal analysis. I carried out all of the statistical analysis, designing the strategy and implementing it in R (version 4.5.1):
- energy adjustment of the dietary data;
- the variance-aware choice between rank tests;
- the PCA-based B-Complex Index;
- the multivariable logistic model and its diagnostics.
Recruitment and data collection were done by the clinical teams of Hospital Infantil de México Federico Gómez and Hospital Militar de Especialidades de la Mujer y Neonatología.
The study
- Cases: 75 consecutive mother–child pairs with a complex congenital heart defect confirmed by echocardiography (January 2024 – December 2025). The most frequent diagnoses were total anomalous pulmonary venous connection and tetralogy of Fallot (13/75, 17.3% each), followed by coarctation of the aorta and transposition of the great arteries (7/75, 9.3% each).
- Controls: 160 healthy mother–infant pairs selected consecutively from a maternal nutrition database established in 2019, with the same eligibility criteria except for the heart defect.
- Exclusions: pre-existing or gestational diabetes, exposure to teratogens (smoking, alcohol, substance use, medications such as lithium or retinoic acid) and positive TORCH tests.
- Exposure: a food-frequency questionnaire validated in the Mexican population (for folate), covering the whole pregnancy and converted to daily intakes of energy, macronutrients and vitamins.
Statistical approach
1. Energy adjustment
Women who eat more take in more of every nutrient, so raw intakes mostly measure how much a woman eats. Vitamins were expressed as amounts per 1000 kcal (nutrient density) and macronutrients as percentages of energy (Atwater factors: 4 kcal/g for carbohydrates and protein, 9 kcal/g for fat). Total energy still enters the final model as a covariate.
2. Rank tests that respect unequal variances
Dietary and perinatal data are skewed, so groups were compared with rank tests. The Wilcoxon–Mann–Whitney test assumes both groups have the same spread; when they do not, its type I error is inflated. Each variable therefore went through a decision rule:
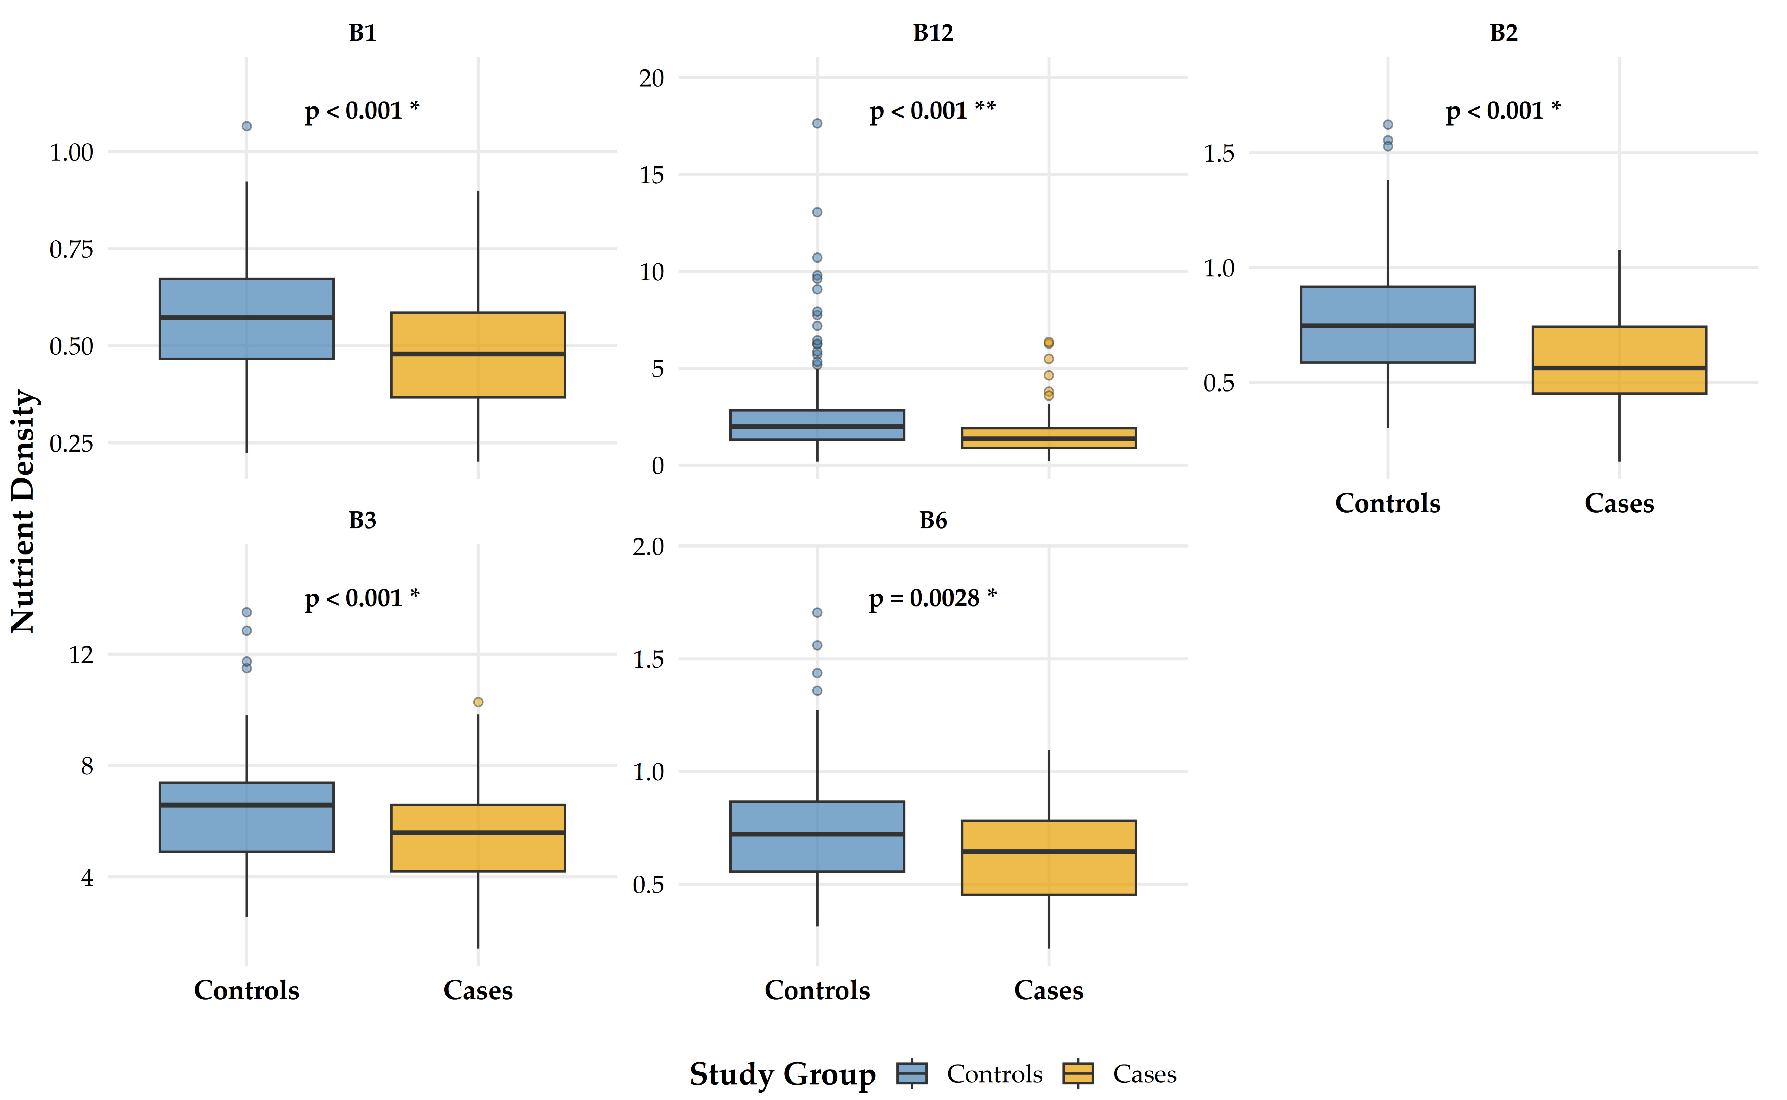
The rule in the published data (Table 1): birth weight (Fligner–Killeen p = 0.001) and birth length (p = 0.002) had unequal spreads between groups, so they went to Brunner–Munzel. Maternal age (0.342), BMI (0.190) and weeks of gestation (0.165) did not, so they went to Wilcoxon. Among the vitamins, B12 was compared with Brunner–Munzel (Figure 1).
3. A B-Complex Index from principal components
The five vitamins come from the same foods, so their intakes are highly correlated. Putting all five in one regression would make the coefficients unstable (variance inflation); testing them one by one ignores that they act together.
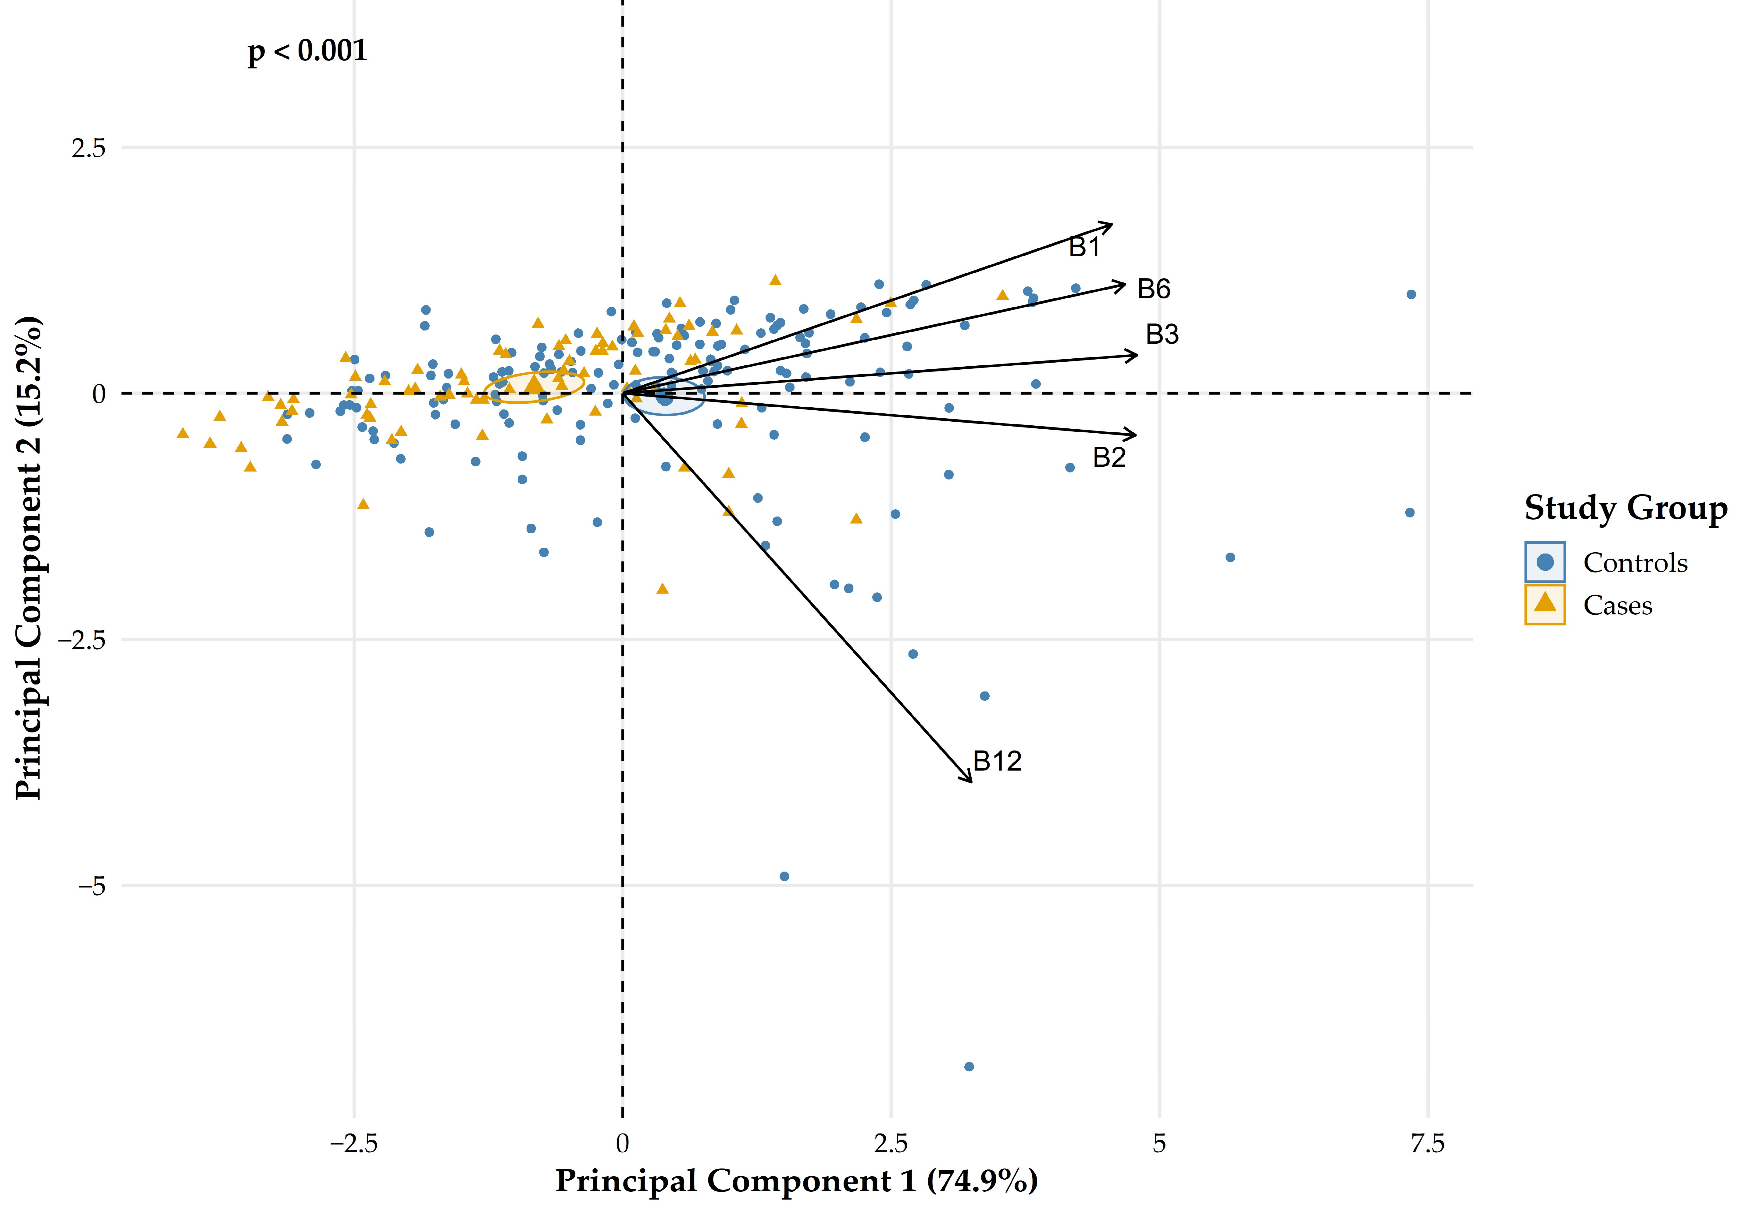
- The energy-adjusted intakes were standardised to Z-scores (they are measured in mg and µg) and entered into a PCA.
- PC1 explained 74.9% of the total variance (PC2: 15.2%), and all five vitamins loaded positively on it: PC1 measures the overall B-vitamin density of the diet.
- Each mother’s PC1 score became the B-Complex Index: one continuous exposure, without collinearity.
- Folate was deliberately left out, because dietary folate and periconceptional folic acid were separate prespecified exposures.
- The mean index differed between groups (independent-samples t-test, p < 0.001).
4. Adjusted logistic regression for a case–control design
\[ \operatorname{logit} P(\text{case}) = \beta_0 + \beta_1\,\text{B-Complex Index} + \beta_2\,\text{age} + \beta_3\,\text{energy} + \beta_4\,\text{vitamin supplement} + \beta_5\,\text{folic acid} \]
In a case–control study the share of cases is fixed by design, so absolute risks cannot be estimated. Odds ratios can: under case–control sampling only the intercept is distorted, and the slopes keep their meaning. Covariates were chosen for clinical relevance.
5. Checking the model
Ordinary residuals tell you little for a binary outcome. The model was checked with:
- Simulated randomized quantile residuals (DHARMa): Kolmogorov–Smirnov, dispersion and outlier tests showed no evidence of misspecification or overdispersion.
- Cook’s distance and leverage: no observation exceeded Cook’s D = 0.5, so no single mother drove the result.
The diagnostic plots are in the article’s Supplementary Figure S1.
Results
Characteristics of mothers and newborns (Table 1)
Case mothers were older (p = 0.002) and less often took vitamin supplements during pregnancy (p = 0.022). Their infants had lower birth weight (p = 0.001) and were more often delivered by cesarean section (p < 0.001).
| Characteristic | Cases (n = 75) | Controls (n = 160) | Fligner–Killeen p | p |
|---|---|---|---|---|
| Age (y) | 24.0 (21.0, 29.0) | 22.0 (19.0, 25.2) | 0.342 | 0.002 |
| BMI before pregnancy (kg/m2) | 23.7 (21.7, 27.9) | 23.4 (21.1, 26.5) | 0.190 | 0.248 |
| Perinatal folic acid supplementation, n (%) | 73 (97.3) | 149 (93.1) | NA | 0.234 |
| Vitamin supplementation during pregnancy, n (%) | 56 (74.7) | 140 (87.5) | NA | 0.022 |
| Weight (kg) | 2850 (2495, 3220) | 3105 (2877, 3322) | 0.001 | 0.001 |
| Length (cm) | 49 (47, 51) | 49.3 (48, 50) | 0.002 | 0.573 |
| Sex, male, n (%) | 40 (53.3) | 82 (51.3) | NA | 0.781 |
| Weeks of gestation | 39 (38, 40) | 39 (38, 40) | 0.165 | 0.742 |
| Cesarean delivery, n (%) | 70 (93.3) | 49 (30.6) | NA | <0.001 |
| Apgar score at 1 min (≤8), n (%) | 66 (88.0) | 139 (86.8) | NA | 0.999 |
Dietary intake (Table 2 and Figure 1)
Energy intake showed a trend (p = 0.054). Case mothers had lower protein (p = 0.009) and lipid (p = 0.007) intakes; carbohydrates and folate did not differ. All five B vitamins were lower among case mothers (all p < 0.01).
| Per 1000 kcal | Cases (n = 75) | Controls (n = 160) | p |
|---|---|---|---|
| Energy (kcal) | 2752 (2106, 3630) | 2505 (1941, 3350) | 0.054 |
| Protein (g) | 38.3 (34.9, 42.7) | 40.4 (36.9, 42.7) | 0.009 |
| Carbohydrates (g) | 59.1 (52.7, 64.1) | 56.9 (51.9, 64.8) | 0.474 |
| Lipids (g) | 25.8 (22.3, 28.8) | 27.0 (24.4, 29.7) | 0.007 |
| Folate (μg) | 147.2 (98.8, 183.7) | 151.5 (119.5, 184.8) | 0.390 |
| Vitamin B1 (mg) | 0.48 (0.37, 0.59) | 0.57 (0.47, 0.67) | <0.001 |
| Vitamin B2 (mg) | 0.56 (0.45, 0.74) | 0.75 (0.59, 0.92) | 0.001 |
| Vitamin B3 (mg) | 5.6 (4.21, 6.59) | 6.58 (4.91, 7.38) | <0.001 |
| Vitamin B6 (mg) | 0.72 (0.56, 0.87) | 0.64 (0.45, 0.78) | 0.003 |
| Vitamin B12 (μg) | 1.37 (0.89, 1.91) | 1.98 (1.32, 2.83) | <0.001 |
Note on vitamin B6: the values are shown as published. Figure 1 of the same article (below) shows the lower B6 median in cases (about 0.64 vs 0.72 in controls), consistent with the text, so the two B6 medians in the published table appear to be transposed.
The B-Complex Index (Figure 2)
Adjusted model (Table 3)
| Variable | Adjusted OR | 95% CI | p |
|---|---|---|---|
| B-Complex Index (per unit of PC1 score) | 0.707 | 0.586–0.843 | 0.0001 |
| Maternal age (per year) | 1.058 | 1.007–1.112 | 0.0248 |
| Total energy intake (per kcal) | 1.000 | 1.000–1.001 | 0.0331 |
| Vitamin supplementation in pregnancy | 0.523 | 0.239–1.146 | 0.1049 |
| Periconceptional folic acid supplementation | 0.337 | 0.090–0.996 | 0.0491 |
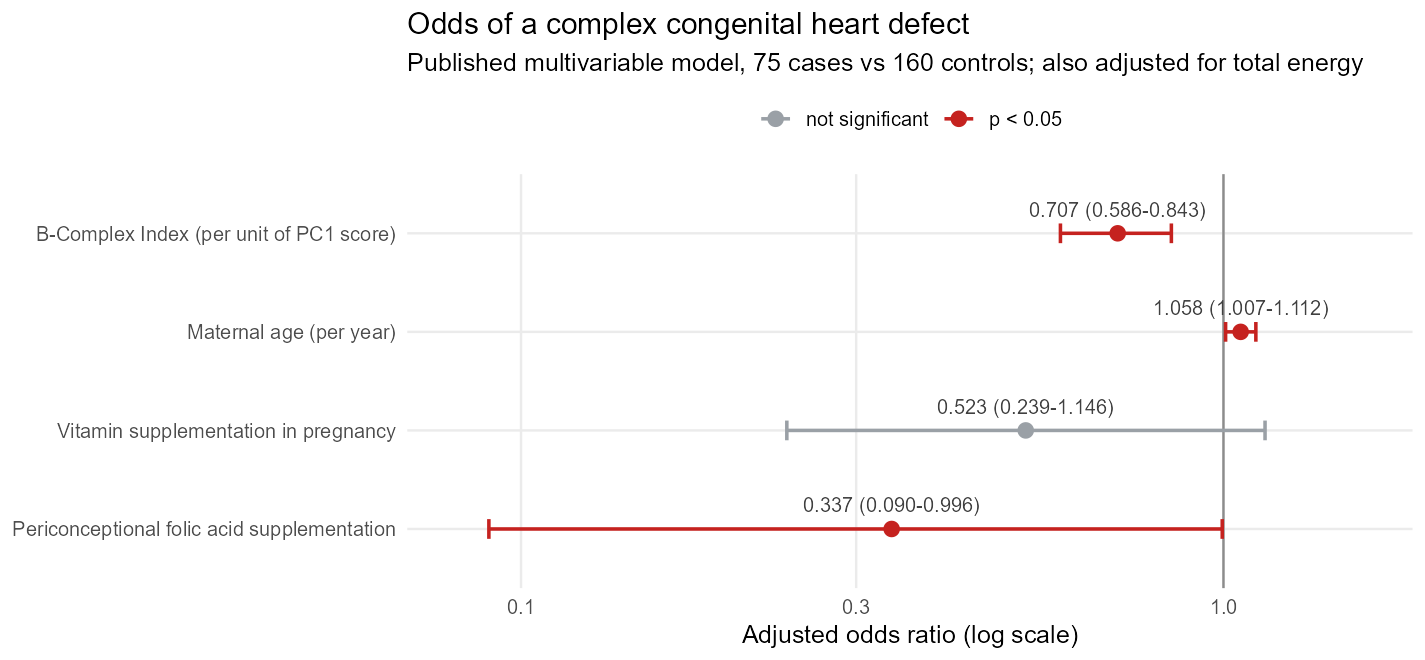
- B-Complex Index: OR 0.707 (0.586–0.843, p = 0.0001). Each one-unit increase was associated with a 29.3% decrease in the odds of a complex defect.
- Periconceptional folic acid supplementation: OR 0.337 (0.090–0.996, p = 0.0491), independently associated with lower odds.
- Maternal age: OR 1.058 per year (1.007–1.112, p = 0.0248), a modest positive association.
- Total energy intake: OR 1.000 (1.000–1.001, p = 0.0331).
- Vitamin supplementation during pregnancy: OR 0.523 (0.239–1.146), not significantly associated (p = 0.1049).
Limitations stated in the article
- Case–control design: associations, not causal effects; dietary recall may be biased.
- Questionnaire, not biomarkers: the questionnaire was validated for folate, not specifically for B1, B2, B3, B6 and B12.
- Timing: it covered the whole pregnancy, not specifically the weeks of cardiac organogenesis, and was answered after delivery.
Code
The patient data are not public. The repository contains the analysis pipeline in R (variance check → Wilcoxon or Brunner–Munzel, PCA index, adjusted logistic model, DHARMa and Cook’s distance). It runs end to end on simulated data with the study’s structure (75 cases, 160 controls, skewed and correlated intakes). Its output only shows that the code works; it is not the study’s result, so none of it appears on this page.
Rscript run_all.R # a few secondsHow to cite
@article{vilchisgil2026bcomplex,
  author  = {Vilchis-Gil, Jenny and Gómez-Jiménez, Aaron M. and Santillán-Orgas, María E. and
             Segura-Stanford, Begoña and Navarro-Castellanos, Iñaki and Gomez-Lopez, Jacqueline and
             Morán-Espinosa, Mari C. and Granados-Riveron, Javier T. and Sanchez-Urbina, Rocío},
  title   = {Maternal Dietary B-Complex Vitamin Pattern and Risk of Complex Congenital Heart
             Defects in a Mexican Population},
  journal = {Nutrients},
  year    = {2026},
  volume  = {18},
  number  = {16},
  pages   = {2693},
  doi     = {10.3390/nu18162693}
}
Tables, figures and study details are reproduced from the open-access article (CC BY 4.0).